Multi-Image Visualizations
Multi-image visualizations can be created by simply changing the visibility of your image data in the Data Properties and Settings panel. You should note that objects at the top of the list are displayed over objects that are lower down. To improve visualizations, you can change the opacity of images within a view, as well as apply color ramps.
Dragonfly provides automatic and manual registration to register datasets (Image Registration). You should check registration accuracy prior to image interpretation and adjust the transparency of the layers appropriately.
- Select the required image data in the Data Properties and Settings panel.
- Adjust the opacity of the selected image in the Opacity mapping box on the Window Leveling panel, as shown below.
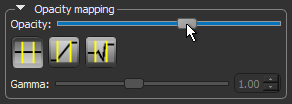
Note You can also adjust opacity in the Opacity Settings dialog (see Opacity Settings).
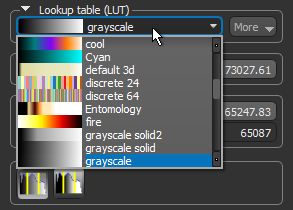
- Choose a color ramp in the Lookup table (LUT) drop-down menu on the Window Leveling panel, as shown below.